This page has links to all of the tropical page include files
for the web team to verify them easily for errors and corrections.
/PS/TROP/includes/basin_list.htm
/PS/TROP/includes/trop-adt.htm
|
ADT |
 |
The ADT provides an automated, objectively-derived estimate of the tropical cyclone location and intensity using the latest official forecast bulletins from the Joint Typhoon Warning Center (JTWC) and from Regional Specialized Meteorological Centers (RSMC), such as the National Hurricane Center (NHC) and the Central Pacific Hurricane Center (CPHC). |
|
/PS/TROP/includes/trop-ATL-sat-img.htm
/PS/TROP/includes/trop-brazil.htm
/PS/TROP/includes/trop-bulletin.htm
|
Bulletins |
 |
Text bulletins disseminated by 0400Z, 1000Z, 1600Z, and 2200Z describing the position and intensity estimates for tropical disturbances and tropical cyclones in the Eastern and Southern Hemispheres. |
|
/PS/TROP/includes/trop-cphc.htm
|
Central Pacific Hurricane Center |
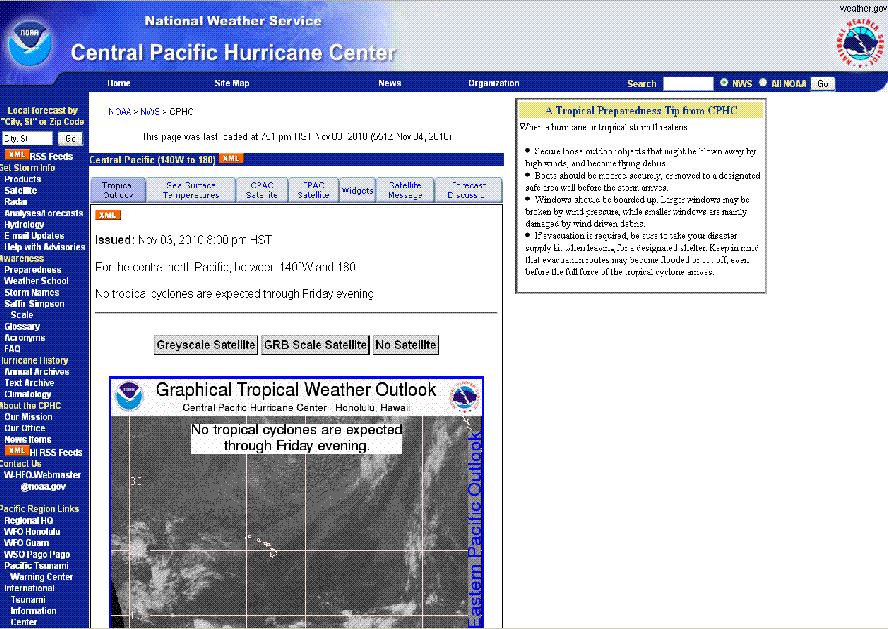 |
The Central Pacific Hurricane Center is the Regional Specialized Meteorological Center (RSMC) for the Central Pacific Basin and is a resource for official tropical cyclone positions, intensities and forecast tracks.
|
|
/PS/TROP/includes/trop-dvorak.htm
/PS/TROP/includes/trop-EPAC-sat-img.htm
/PS/TROP/includes/trop-etrap.htm
|
eTRaP |
 |
The eTRaP is a simple ensemble that allows for the generation of probabilistic forecasts of rainfall in addition to deterministic rainfall totals. |
|
/PS/TROP/includes/trop-IO-sat-img.htm
|
Satellite Imagery |
 |
Static and animated imagery of tropical disturbances, tropical cyclones and areas of interest. Users have the ability to overlay a variety of data on animated imagery loops of tropical storms.
** East of 75E Only **
Tropical Cyclone Floaters |
|
/PS/TROP/includes/trop-jtwc.htm
|
Joint Typhoon Warning Center |
 | The Joint Typhoon Warning Center (JTWC) provides tropical cyclone analysis, forecast and warning support for the Department of Defense, and other US Government assets in the Pacific and Indian Oceans.
|
|
/PS/TROP/includes/trop-miposn.htm
|
Microwave Positions |
 |
Subjective position estimates of tropical disturbances and cyclones across the globe using a variety of microwave sensors.
ATCF Format |
|
/PS/TROP/includes/trop-mtcswa.htm
|
MTCSWA |
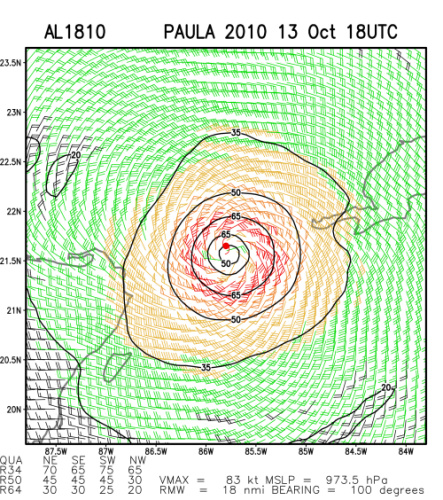 |
MTCSWA combines information from several data sources to create a mid-level wind analysis which is then adjusted to the surface. Eight products are displayed, most notably an inner core scale surface wind analysis. |
|
/PS/TROP/includes/trop-ncep.htm
|
NCEP International Desk |
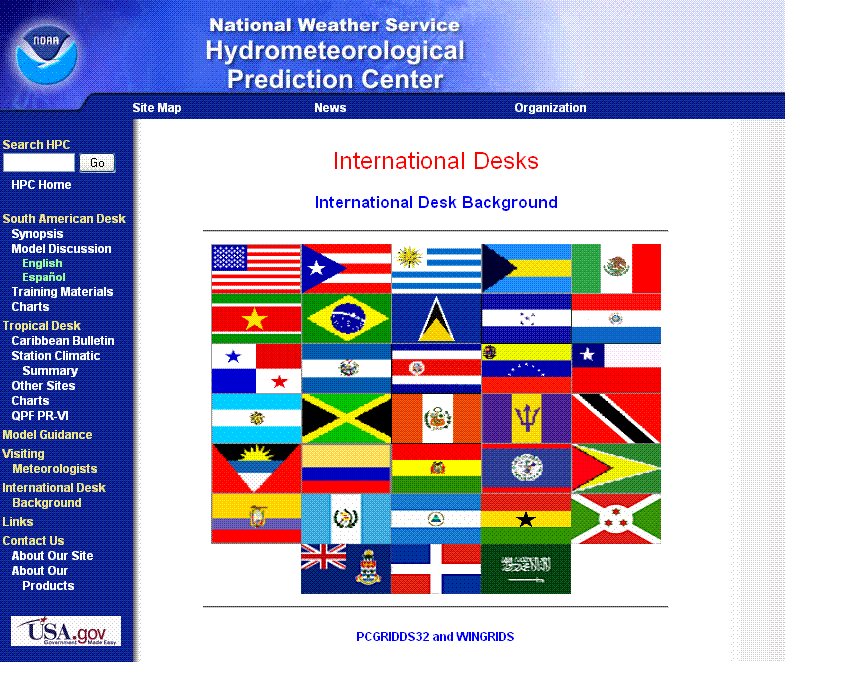 |
NOAA's Hydrometeorological Prediction Center provides visiting scientists meteorological training with an emphasis on the operational use and application of numerical model products. |
|
/PS/TROP/includes/trop-nevl.htm
 |
High-resolution, detailed imagery of tropical cyclones as detected in remotely sensed data. |
|
-->
/PS/TROP/includes/trop-nhc.htm
|
National Hurricane Center |
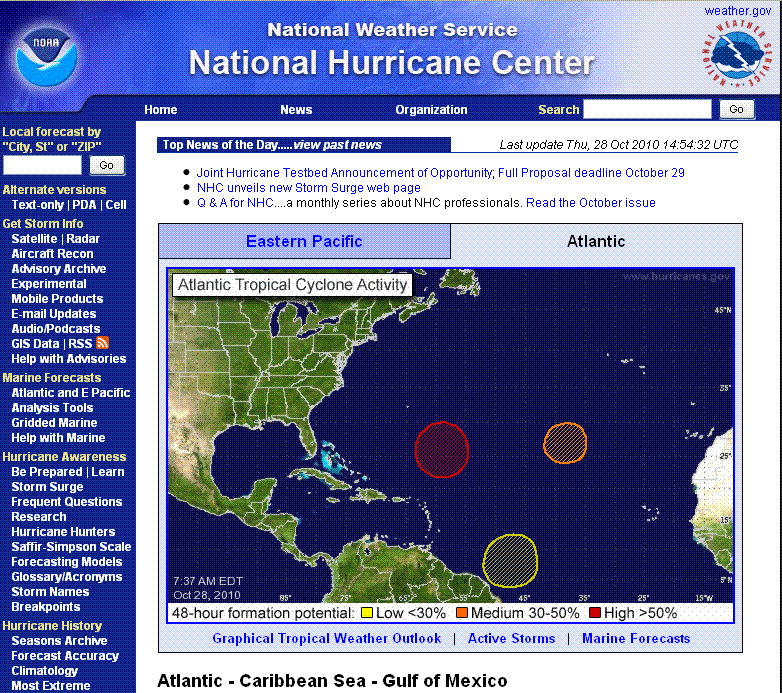 |
The National Hurricane Center is the Regional Specialized Meteorological Center (RSMC) for the Atlantic Basin and is a resource for official tropical cyclone positions, intensities and forecast tracks.
|
|
/PS/TROP/includes/trop-PAC-sat-img.htm
/PS/TROP/includes/trop-rsmc.htm
Regional Specialized Meteorological Centers
Tropical Cyclone Warning Centers* |
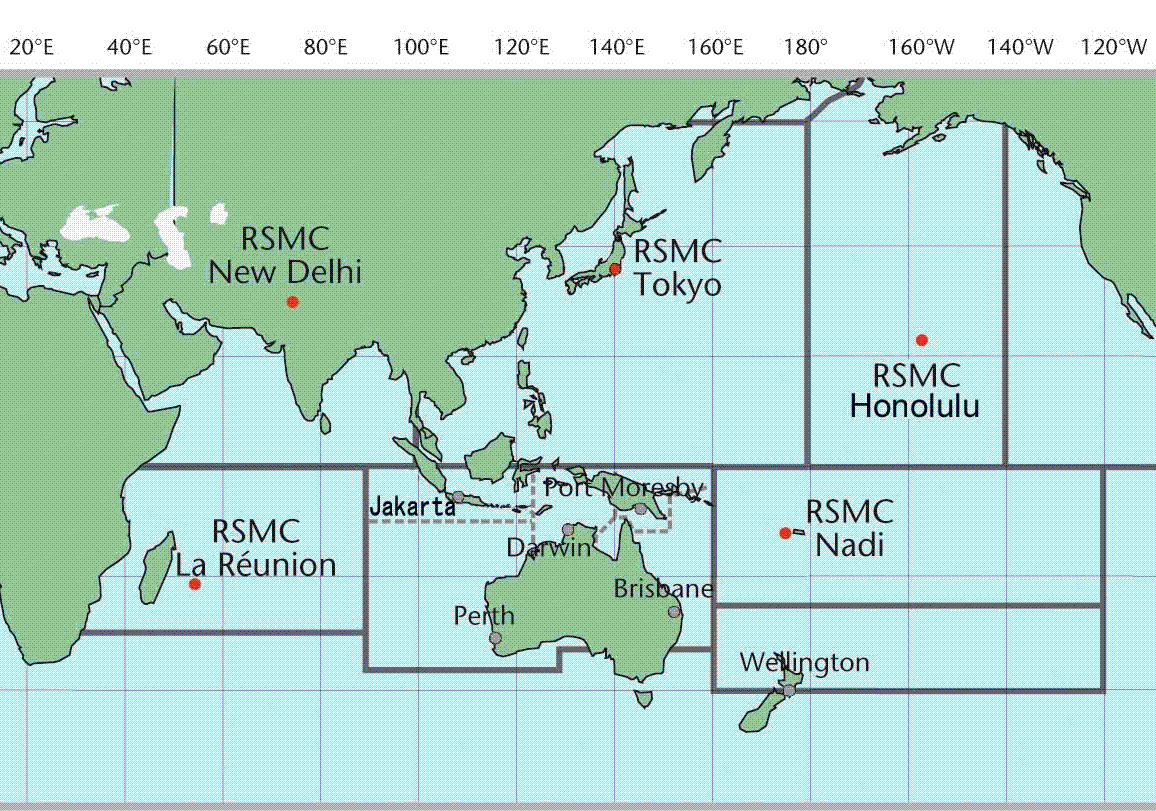 |
Regional Specialized Meteorological Centers and Tropical Cyclone Warning Centers (RSMC/TWTC) provide official position, intensity and forecast tracks for tropical cyclones within their areas of resonsibility.
Tokyo, Japan |
New Delhi, India |
La Reunion, FRA
Jakarta, Indonesia |
Perth, AUS |
Darwin, AUS
Brisbane, AUS |
Wellington, NZ |
Nadi, Fiji |
Port Moresby, PNG
|
|
/PS/TROP/includes/trop-rsmc-wpac1.htm
/PS/TROP/includes/trop-sat-img.htm
/PS/TROP/includes/trop-tcfp.htm
|
TCFP |
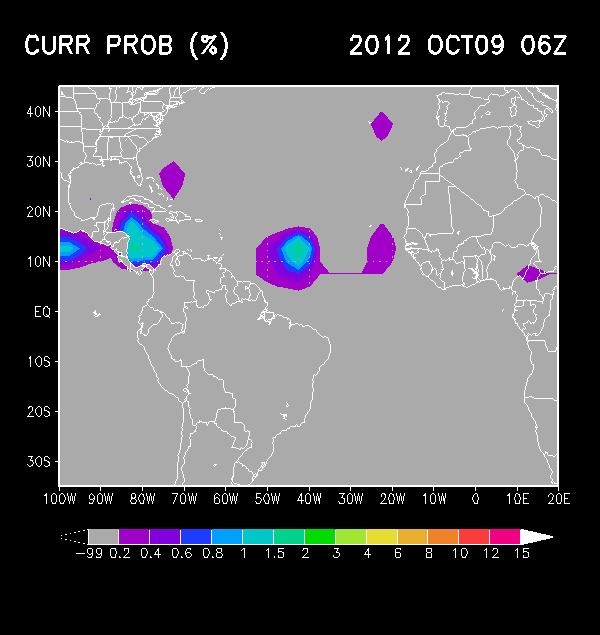 |
The Tropical Cyclone Formation Probability Product provides an estimate of the probability of tropical cyclone formation within the next 24 hours in 1 by 1 degree latitude/longitude areas from 45S to 45N and 0 to 360E. |
|
/PS/TROP/includes/trop-tcfp48.htm
|
TCFP |
 |
The Tropical Cyclone Formation Probability Product provides an estimate of the probability of tropical cyclone formation within the next 24to 48 hours in 1 by 1 degree latitude/longitude areas from 45S to 45N and 0 to 360E. |
|
/PS/TROP/includes/trop-tpw.htm
|
TPW |
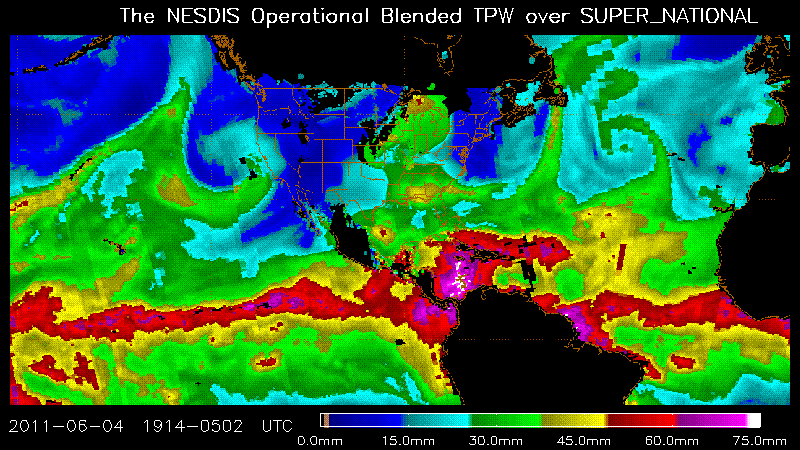 |
The Total Precipitable Water(TPW) is a unified, meteorologically significant TPW field blending AMSU, SSM/I and GPS TPW together, for non-gap global coverage.
Blended TPW | TPW percent |
|
/PS/TROP/includes/trop-WPAC-img.htm
/PS/TROP/includes/trop-top-storms.htm
[an error occurred while processing this directive]
/PS/TROP/includes/trop-fix-notice.htm
|
USER MESSAGE:
The manual Dvorak fixes issued by SAB for tropical disturbances and tropical cyclones in the Eastern and Southern Hemispheres, such as those found at:
http://www.ssd.noaa.gov/PS/TROP/
are being considered for retirement. Specific basins affected are the West Pacific, North Indian, South Indian, South Pacific, South Atlantic and Mediterranean Sea.
The ADT based on forecasts issued by RSMCs in the Eastern and Southern Hemisphere is also being considered for retirement. Specifically, ADT output found on
http://www.ssd.noaa.gov/PS/TROP/adt.html
under the headers for New Delhi, Tokyo, La Reunion, Australia and Nadi would no longer be produced. All other ADT output would continue to be available to users, including ADT output based on JTWC forecasts in the affected areas. Interested parties may address their comments and concerns regarding this proposed retirement to Michael.Turk@noaa.gov through November 18, 2016.
|
/PS/TROP/includes/trop-disclaimer.htm
| Disclaimer: |
Users are reminded that posted SPSD position and intensity estimates are based on the application of the Dvorak technique to satellite imagery. Official determinations of systems' status, location and intensity are provided by the Regional Specialized Meteorological Centers listed above.
|


